



Reproducible statistics without code. At the Swiss Statistics Meeting we refitted a published study on tiger mosquito control by clicking: reading the data from the publisher's website, fitting the models, and exporting the whole analysis as a Quarto report.
blockr is a no-code dashboard builder for R. At the Swiss Statistics Meeting in Rorschach we wanted to show how we can use it to do reproducible statistics without code. The presentation was not free from technical difficulties…
 Photo of Aedes albopictus by James Gathany, CDC, public domain
But that should not hide the beauty of the approach! With a few clicks, we can reproduce the statistical analysis from a study that Matteo Tanadini, of Zurich Data Scientists, published in one of his papers. We read the data from the internet, generate reproducible R code by clicking, and export everything as a Quarto report.
The study
The tiger mosquito reached southern Switzerland in 2003, and Ticino has run a control programme against it since 2009. To find out whether the programme works you need towns that do not run one, which is what the Italian side of the border provides. The survey covered six towns inside a 7 km radius, three under the programme and three not, with 36 ovitraps and one season of egg counts in 2019.
The paper is open access:
Ravasi D, Parrondo Monton D, Tanadini M, Flacio E (2021). Effectiveness of integrated Aedes albopictus management in southern Switzerland. Parasites & Vectors 14, 405. doi:10.1186/s13071-021-04903-2 (CC BY 4.0)
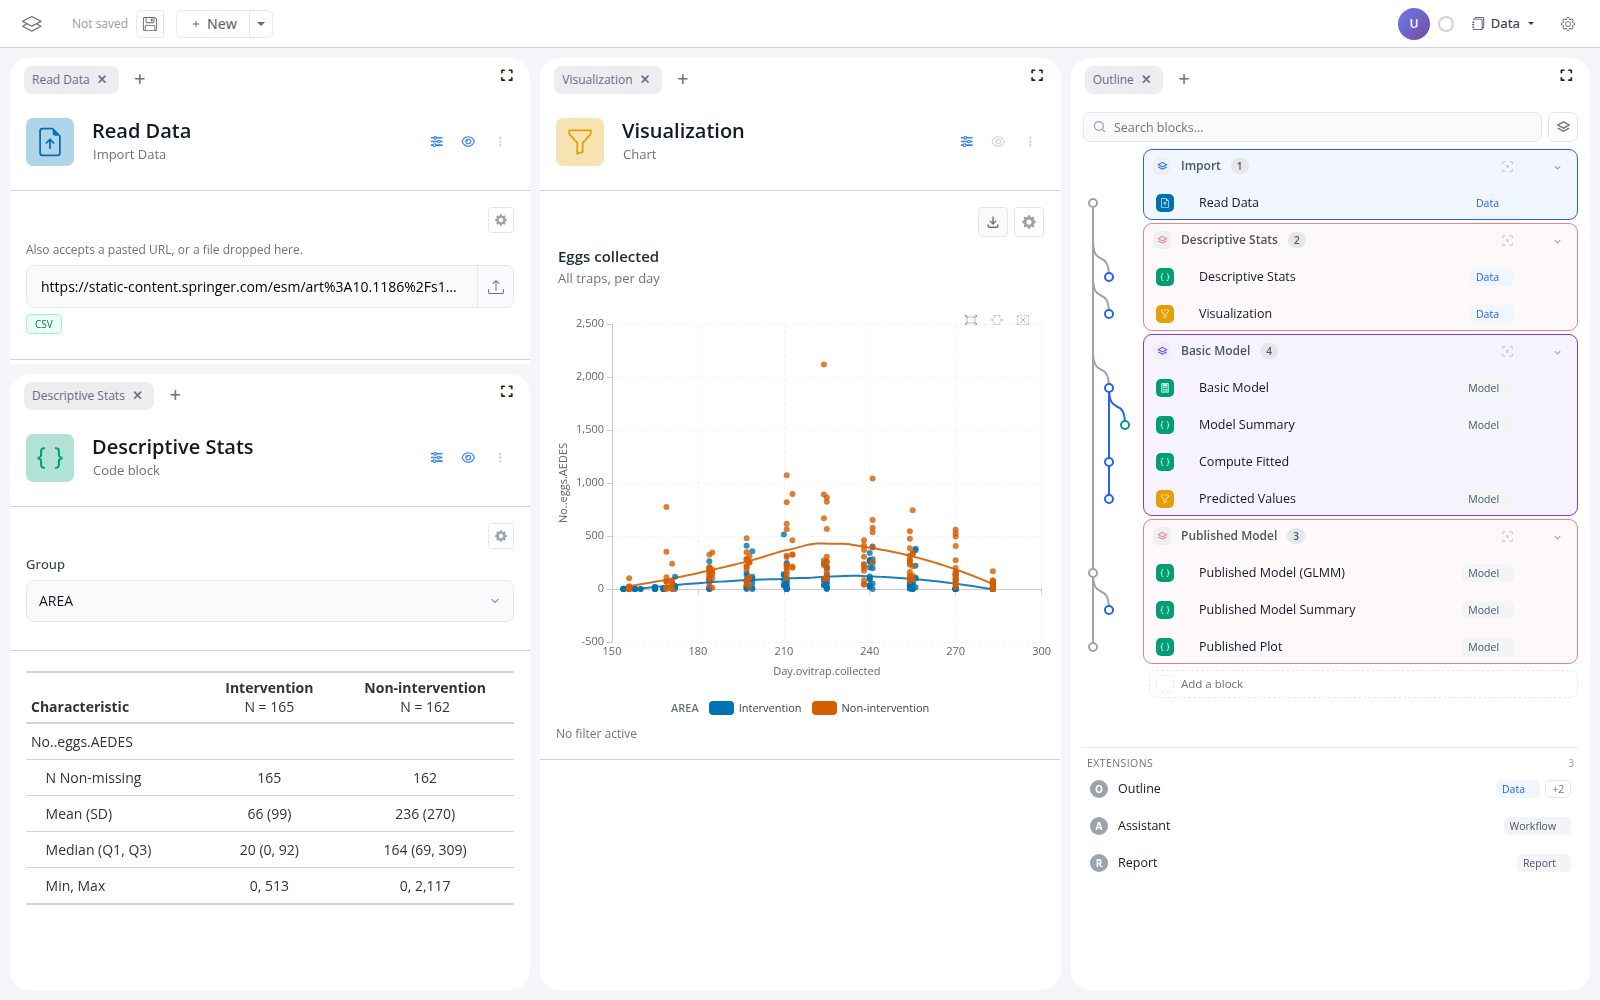
In the blockr application, we use a read block to download the data directly from the publisher’s website. The pipeline performs a descriptive analysis, and fits two models.
Do you know a better plot to visualize? Try here.
The model
The response variable is the number of eggs laid in an ovitrap. So we used models suited to count data, such as a Poisson or a negative binomial model. The predictor of main interest is “Area”, which identifies whether the intervention programme was used or not. Both the response variable and the predictor were picked from dropdowns, and the summary appears automatically below the model call.
The published model is a negative binomial mixed model with a seasonal term, a trap random intercept and a municipality random intercept.
Do you think it should be modeled differently? Try here.
The document
Since we like the results, we want to put them in a report. In the report extension, we can pick every block’s output and arrange it together with text blocks.
The blocks produce ordinary R code. There is no blockr call anywhere in the document, so it renders in an empty directory with quarto.
This is crucial for the whole argument: the user can interact with a transparent and reproducible document that keeps the code behind it.
The assistant
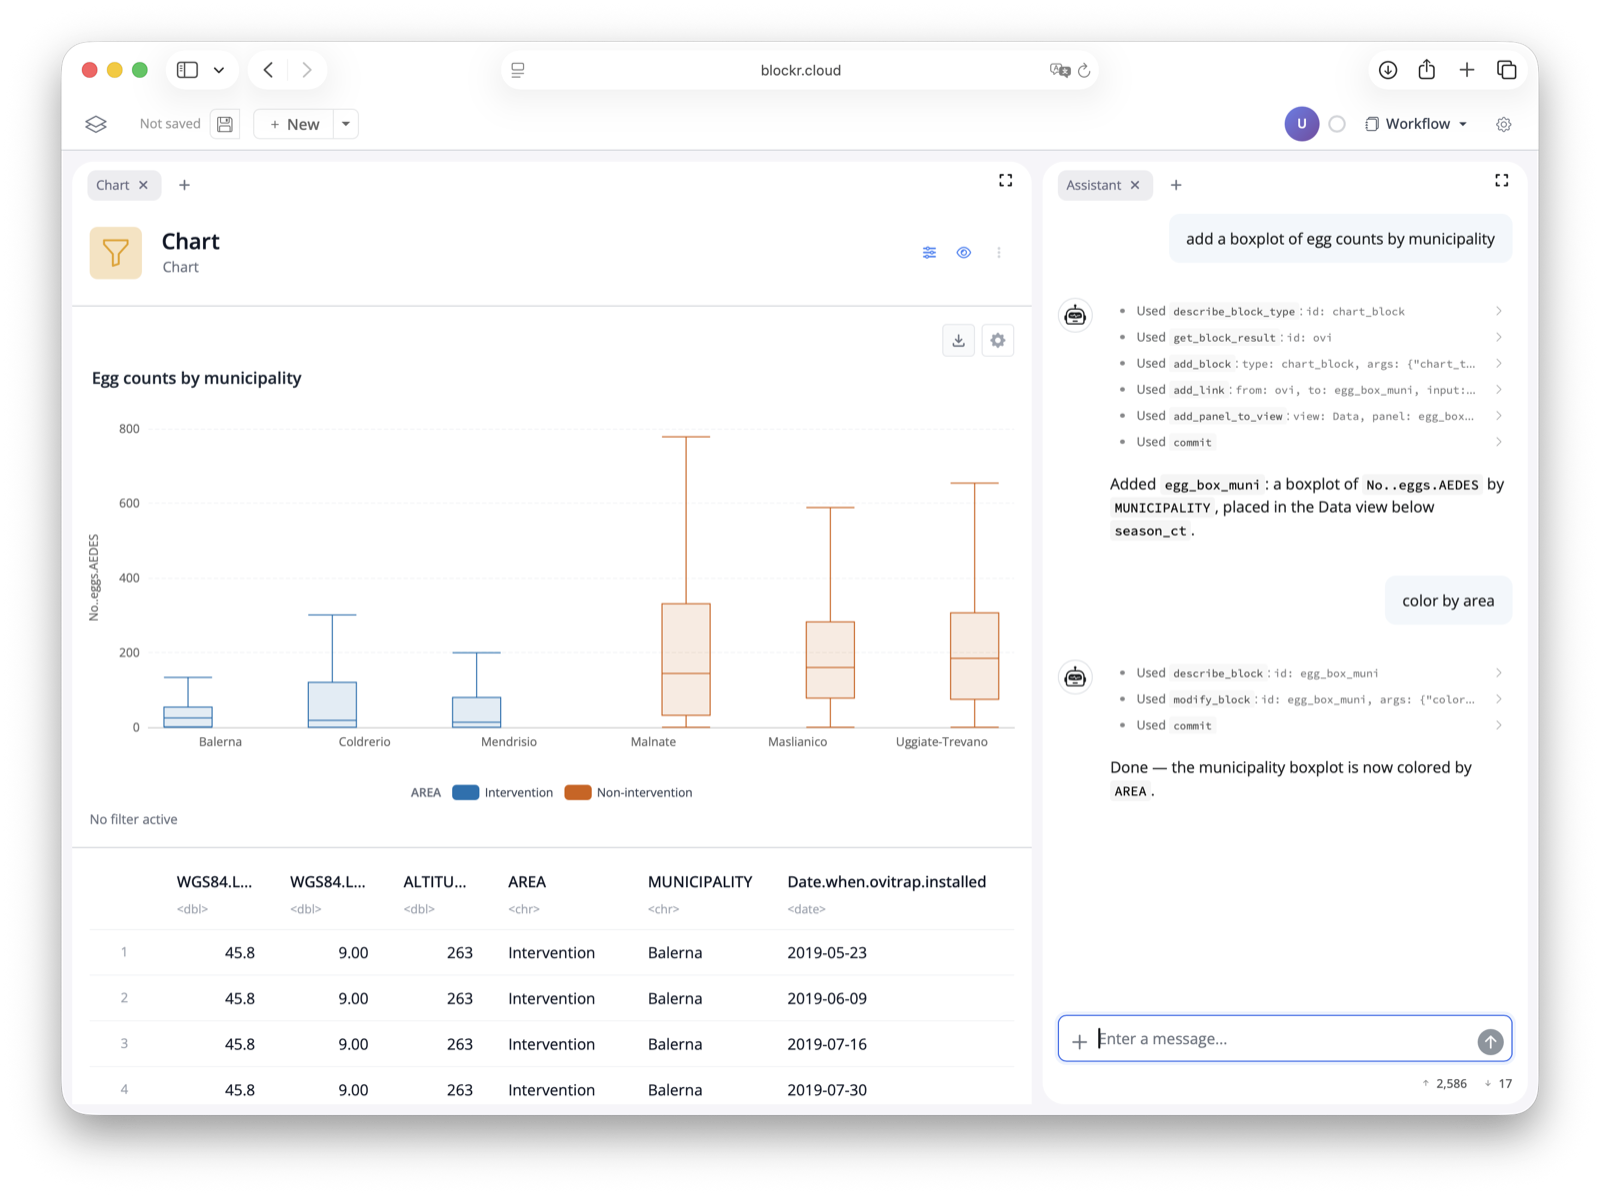
Instead of clicking, we can also just ask. In the blockr assistant, we ask:
add a boxplot of egg counts by municipality
And the pipeline will be extended accordingly.
Try it
blockr was developed in collaboration with Bristol Myers Squibb. It is fully open source under GPL-3.
If you would rather start from nothing, start with an empty board. To run blockr locally or deploy it yourself, see the example page. The full documentation is on blockr.site.