


A recap of my R/Medicine 2026 talk. blockr is a no-code dashboard builder for R. We demo a clinical explorer where updates take minutes instead of weeks. This open-source work was done in collaboration with Bristol Myers Squibb.
blockr is a no-code dashboard builder for R. Builders create workflows by clicking blocks together instead of writing code.
Earlier this month I took this idea to R/Medicine 2026. The demo was a clinical exploration tool we built in partnership with Bristol Myers Squibb. You can play with the deployed version here:
blockr.cloud/app/clinical-explorer

Why this matters for clinical work
In a traditional Shiny app, the exchange between users and developers is costly. Every new request needs a development sprint. blockr cuts that cost by introducing a new role: the builder. Building a dashboard is point-and-click, or AI-assisted, not coding. That brings the time to update a dashboard from weeks to minutes.
What’s in the talk
The recording shows both sides of the workflow: end-users exploring a dashboard, and builders making one.
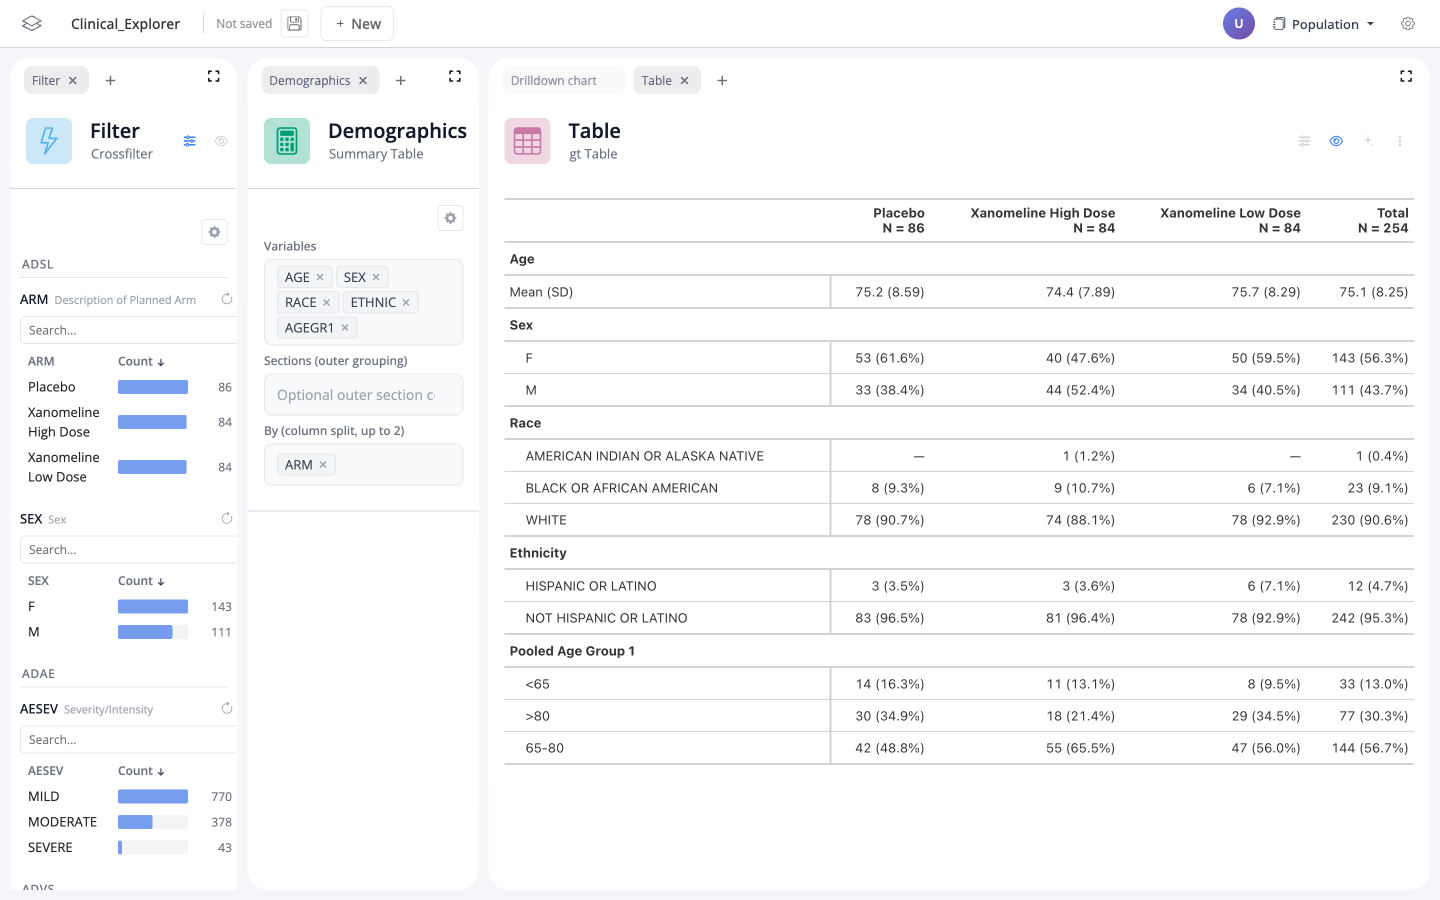
- As an end user: cross-filtering three ADaM tables at once (arm, AE severity, pulse rate) to narrow a cohort to two patients.
- As a builder: empty board to a working faceted chart in under two minutes.
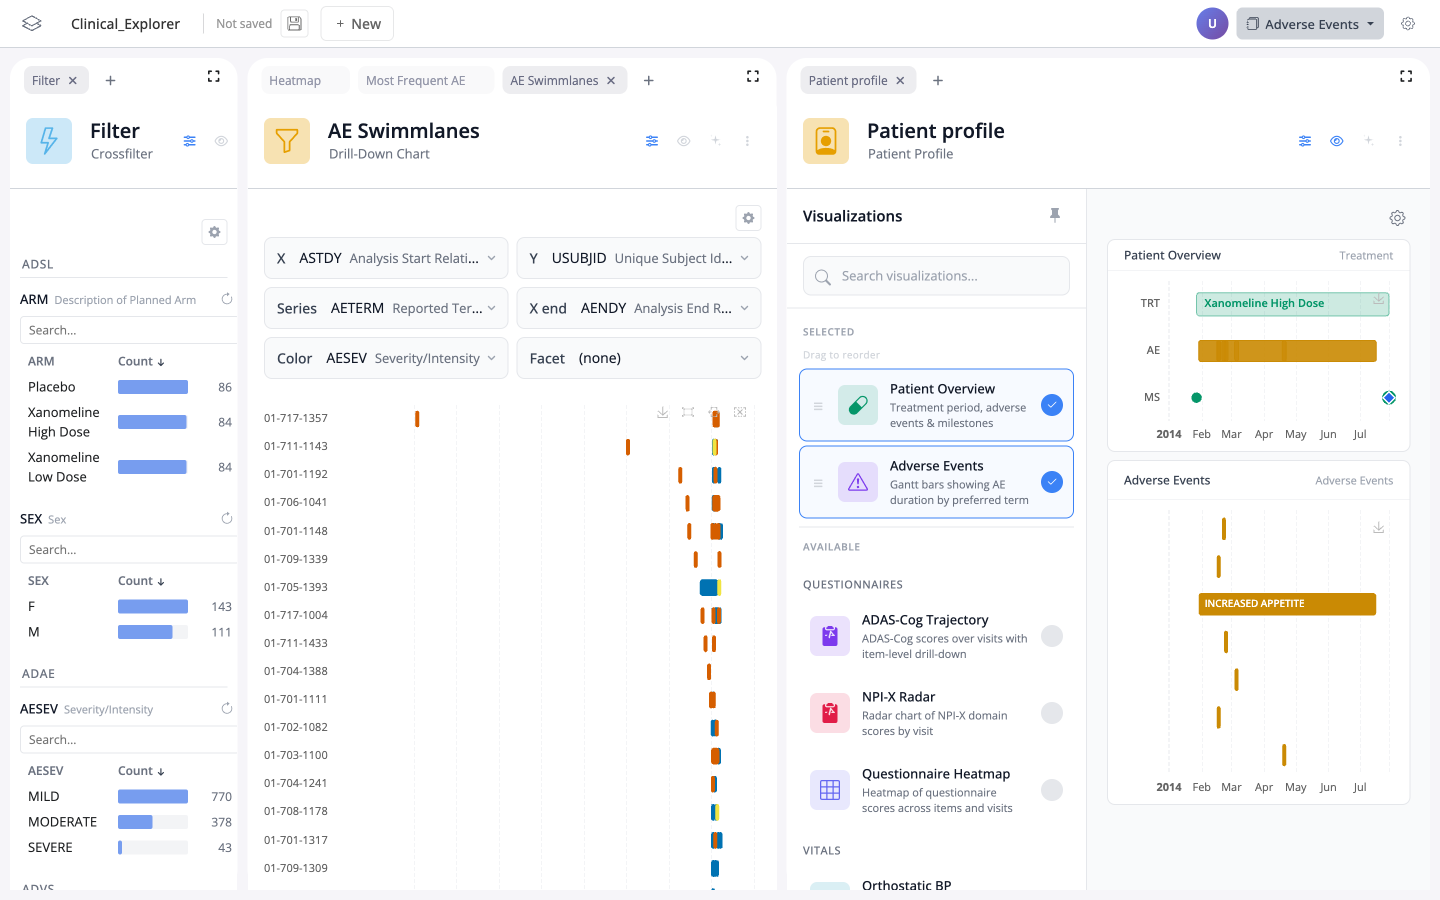
- As a builder: opening the real multi-page Clinical Explorer and adding a new drill-down chart next to a swim-lane plot and a patient profile.
Become a builder
You can try being a builder right now in the empty playground, no install needed. To run the full Clinical Explorer locally, install blockr and the clinical extras (blockr.bi, blockr.dm, blockr.session, blockr.pharma) and follow the steps on the blockr site: