cynkra


blockr: Daten-Pipelines ohne Code

Daten-Workflows visuell erstellen, Schritt für Schritt. Auf R gebaut, für alle zugänglich.

blockr ist ein Framework für visuelle Datenanalyse per Point-and-Click. Finanziert von Bristol-Myers Squibb, entwickelt von cynkra.

Ausprobieren

Warum blockr


decorative background

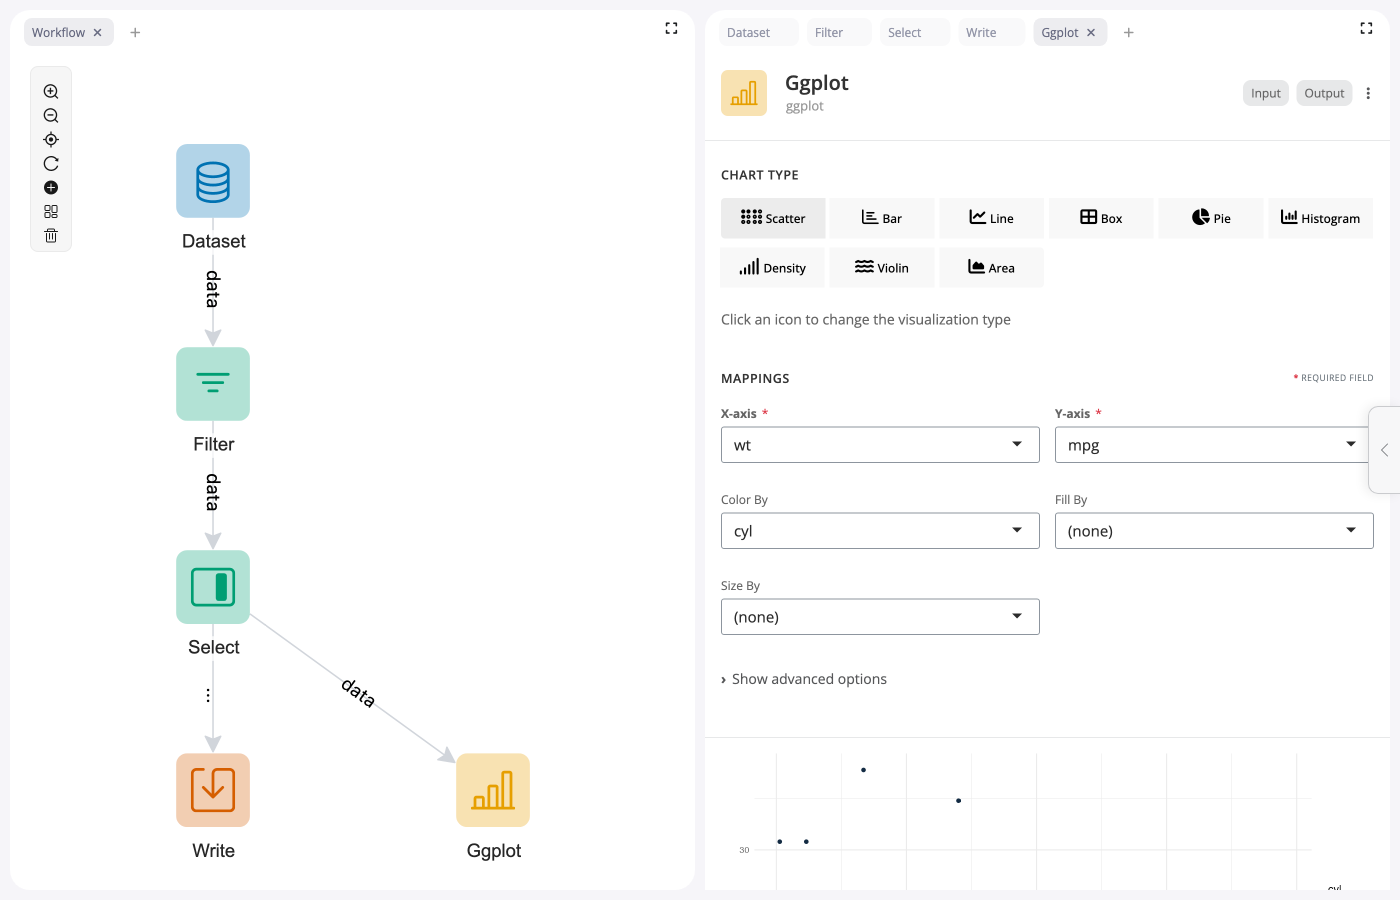
Daten erkunden durch Verbinden von Blöcken. Jeder Block ist ein Schritt - filtern, transformieren, visualisieren. Echtzeit-Vorschau zeigt Ergebnisse sofort. Keine R-Kenntnisse nötig.

Für Analysten

decorative background

Gebaut auf R mit Erweiterungspaketen für dplyr, ggplot2 und mehr. Workflows jederzeit als R-Code exportierbar.

Basiert auf R

decorative background

Eigene Blöcke für jede Domäne erstellen. Datenquellen anbinden, spezialisierte Transformationen bauen, branchenspezifische Workflows entwickeln.

Für Entwickler

Aus dem Blog

Introducing blockr: Data Apps Without Code

In this blog post we celebrate the first stable release of blockr, a tool to build data apps in minutes, using a point and click user interface. See what is included in this first release and learn how to get started.

Weiterlesen

Über den Autor

Mike Page

Mike Page is a data scientist with more than five years of experience working with R in the third sector. Here, his focus has been on developing open-source Shiny apps and tools such as the humaniverse collection of R packages. Mike holds a Masters by Research degree in psychoendocrinology and is interested in R package design, Shiny, and data visualisation. He joined cynkra in October 2023.

Fokus-Projekt


blockr is a framework for data analysis using a web-based point and click user interface. It enables visual programming in R, allowing users to create powerful data workflows through an intuitive interface.

Key Features

  • User-Friendly Interface for building data pipelines
  • Flexible block-based workflow system
  • Extensible with custom blocks (dplyr, AI, IO, SDTM)
  • Reproducible and shareable pipelines
  • Real-time interactive feedback
open source project

The foundation of the blockr ecosystem. Provides the core infrastructure for building block-based data workflows, including the block registry, DAG execution engine, and Shiny integration.

Key Features

  • Block registry and management
  • DAG-based workflow execution
  • Shiny server integration
  • Extensible plugin system
open source project

Data transformation blocks powered by dplyr. Filter rows, select columns, mutate, summarize, arrange, and join tables - all through a visual interface.

Key Features

  • Filter, select, mutate operations
  • Group by and summarize
  • Join and merge tables
  • Arrange and sort data
open source project

Create beautiful visualizations with ggplot2-powered blocks. Scatter plots, bar charts, line graphs, histograms and more - with full theming support.

Key Features

  • Scatter, bar, line, histogram plots
  • Aesthetic mappings via UI
  • Faceting and themes
  • Interactive plot configuration
open source project

Import and export data from multiple sources. Support for CSV, Excel, Parquet, and database connections - making data accessible to your workflows.

Key Features

  • CSV, Excel, Parquet support
  • Database connections
  • URL and API data sources
  • Export to multiple formats
open source project

blockr.ai extends our blockr framework with AI capabilities for natural language-driven data analysis.

Key Features

  • AI-powered plot creation through natural language
  • Intelligent data transformations
  • Integration with leading AI models
  • Composable blocks for flexible workflows
  • Seamless integration with the blockr ecosystem
open source project